Updated February 2026. These e-bike usage statistics highlight how quickly electric-assisted cycling is spreading—across personal riding, bike share, and national travel patterns.
ebike usage statistics
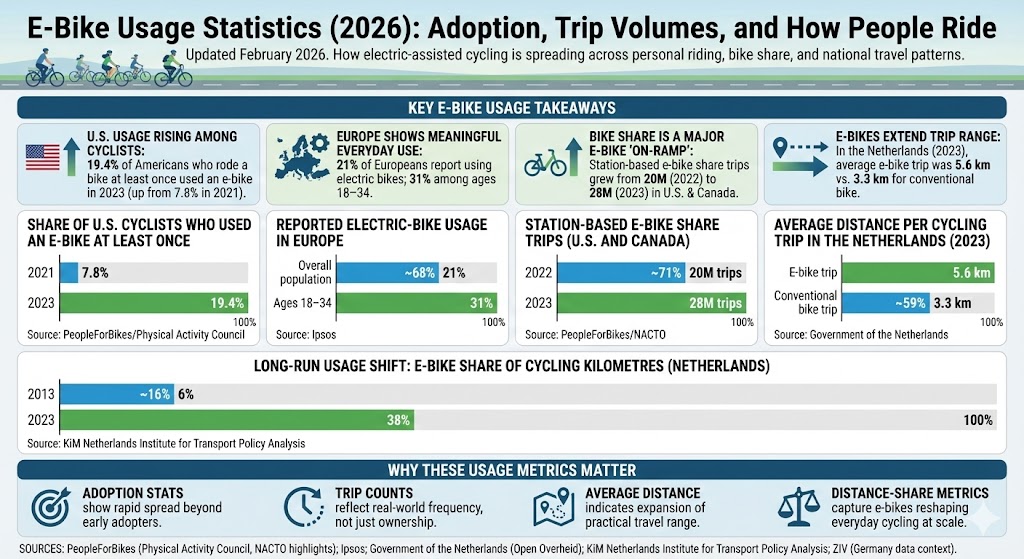
Key e-bike usage takeaways
U.S. usage is rising among cyclists: 19.4% of Americans who rode a bike at least once reported using an e-bike in 2023 (up from 7.8% in 2021).
Europe shows meaningful everyday use: 21% of Europeans report using electric bikes; among ages 18–34, it’s 31%.
Bike share is a major e-bike “on-ramp”: station-based e-bike share trips grew from 20 million (2022) to 28 million (2023).
E-bikes extend trip range: in the Netherlands (2023), the average e-bike trip was 5.6 km vs. 3.3 km for a conventional bike.
High penetration markets are shifting fast: in the Netherlands, e-bikes accounted for 38% of all cycling kilometres in 2023; in Germany, industry estimates ~15.7 million e-bikes were on the roads in 2024.
U.S. e-bike usage among people who ride bikes
One useful way to track “usage” is to look at how many people who ride any bike report riding an e-bike at least once. In U.S. survey reporting shared by PeopleForBikes (from the Physical Activity Council), the share jumped sharply between 2021 and 2023.
Share of U.S. cyclists who used an e-bike at least once
Label
Bar
Value
2021
7.8%
2023
19.4%
Max = 19.4%. Widths: 2021 40.21%, 2023 100.00%.
Europe: who reports using electric bikes?
In an Ipsos study on European mobility (2024), reported electric-bike usage is notably higher among young adults (18–34) than the overall population—suggesting e-bikes are becoming a normal part of day-to-day mobility for a large share of people, not just enthusiasts.
Reported electric-bike usage in Europe
Label
Bar
Value
Overall population
21%
Ages 18–34
31%
Max = 31%. Widths: Overall population 67.74%, Ages 18–34 100.00%.
Shared e-bike usage: trips in North American bike share
Shared micromobility data is one of the clearest “usage” signals because it counts trips. In reporting based on NACTO’s shared micromobility work, station-based e-bike share trips increased from 20 million in 2022 to 28 million in 2023. (In the same reporting, e-bike trips represented 46% of all station-based bike share trips in 2023.)
Station-based e-bike share trips (U.S. and Canada)
Label
Bar
Value
2022
20M trips
2023
28M trips
Max = 28M trips. Widths: 2022 71.43%, 2023 100.00%.
How e-bikes change ride length (Netherlands example)
Trip length is another strong indicator of how e-bikes are used: if assistance helps people go farther per ride, it expands which errands and commutes are “bike-able.” A Dutch government publication on the electric bicycle and the cycling landscape reports that in 2023 the average e-bike trip was 5.6 km versus 3.3 km on a conventional bike.
Average distance per cycling trip in the Netherlands (2023)
Label
Bar
Value
E-bike trip
5.6 km
Conventional bike trip
3.3 km
Max = 5.6 km. Widths: E-bike trip 100.00%, Conventional bike trip 58.93%.
Long-run usage shift: e-bike share of cycling kilometres (Netherlands)
In high-cycling countries, “usage share” can be measured as the share of all cycling kilometres done on e-bikes. KiM’s mobility figures for the Netherlands report a rise from 6% (2013) to 38% (2023), showing how electric assistance has moved into the mainstream of everyday cycling.
E-bike share of all cycling kilometres in the Netherlands
Label
Bar
Value
2013
6%
2023
38%
Max = 38%. Widths: 2013 15.79%, 2023 100.00%.
Why these usage metrics matter
“Used an e-bike” adoption stats show how quickly e-bikes are spreading beyond early adopters.
Trip counts (like bike-share trips) reflect real-world frequency rather than ownership alone.
Average trip distance indicates whether e-bikes are expanding practical travel range for errands and commuting.
Distance-share metrics (share of all cycling kilometres) capture how e-bikes reshape everyday cycling at scale.
Ipsos (Apr 5, 2024). European mobility becomes more electrified (electric bike usage overall vs ages 18–34): https://www.ipsos.com/en/european-mobility-becomes-more-and-more-electrified-growing-popularity-electric-bikes-while
Government of the Netherlands (Open Overheid). Invloed van de elektrische fiets op het fietslandschap (avg trip lengths; e-bike km share): https://open.overheid.nl/documenten/683fccb9-bb0c-4a42-89c6-f730afb64647/file
KiM Netherlands Institute for Transport Policy Analysis. Kerncijfers Mobiliteit 2024 (e-bike share of cycling kilometres): https://www.kimnet.nl/site/binaries/site-content/collections/documents/2024/11/18/kerncijfers-mobiliteit-2024/KiM%2BKerncijfers_Mobiliteit_2024_DTdef.pdf
ZIV (Mar 12, 2025). Bicycle industry robust in challenging times (Germany e-bike stock estimate; 2024 market data): https://www.ziv-zweirad.de/en/2025/03/12/bicycle-industry-robust-in-challenging-times/