Bike sharing keeps expanding worldwide, and e-bikes are a major driver of ridership growth in many cities. Here are the most useful, current bike sharing stats.
bike sharing statistics
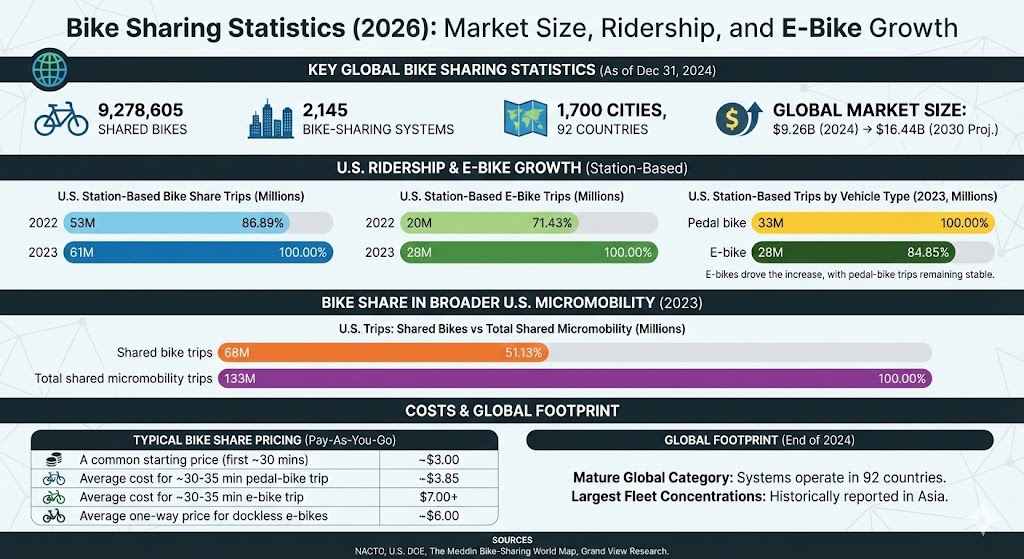
Key bike sharing statistics
9,278,605 shared bikes operated in 2,145 bike-sharing systems across 1,700 cities in 92 countries (as of December 31, 2024).
The global bicycle sharing market was estimated at $9.26B in 2024 and projected to reach $16.44B by 2030.
In the U.S., station-based bike share trips reached 61M in 2023 (up from 53M in 2022).
U.S. station-based e-bike trips rose to 28M in 2023 (up from 20M in 2022).
Based on the above totals, station-based pedal-bike trips were about 33M in both 2022 and 2023, while e-bike trips accounted for most of the increase.
In 2023, the U.S. recorded 68M shared bike trips (within 133M total shared micromobility trips).
Global bicycle sharing market size
Market estimates point to steady growth through 2030 as cities expand programs and add more e-bikes.
Bike Sharing Market Size (Global, USD Billions)
Label
Bar
Value
2024
$9.26B
2030 (proj.)
$16.44B
Max = 16.44. Widths: 2024 56.33%, 2030 (proj.) 100.00%
U.S. bike share ridership is rising
Station-based bike share systems (docked networks that typically offer pedal bikes and e-bikes) increased trips from 2022 to 2023.
U.S. Station-Based Bike Share Trips (Millions)
Label
Bar
Value
2022
53M
2023
61M
Max = 61. Widths: 2022 86.89%, 2023 100.00%
E-bike trips are a major growth engine
E-bikes made up a large and growing share of station-based bike share usage, rising from 20M to 28M trips between 2022 and 2023.
U.S. Station-Based E-Bike Trips (Millions)
Label
Bar
Value
2022
20M
2023
28M
Max = 28. Widths: 2022 71.43%, 2023 100.00%
U.S. Station-Based Trips by Vehicle Type (2023, Millions)
Label
Bar
Value
Pedal bike
33M
E-bike
28M
Max = 33. Widths: Pedal bike 100.00%, E-bike 84.85%
Bike share in the broader micromobility picture
In the U.S., shared bike trips are commonly reported alongside shared e-scooter and other micromobility trips. In 2023, shared bike trips totaled 68M out of 133M total shared micromobility trips.
U.S. Trips: Shared Bikes vs Total Shared Micromobility (2023, Millions)
Label
Bar
Value
Shared bike trips
68M
Total shared micromobility trips
133M
Max = 133. Widths: Shared bike trips 51.13%, Total shared micromobility trips 100.00%
Costs and affordability
Pricing varies widely by city and operator, but the table below summarizes commonly cited pay-as-you-go price points for station-based bike share and e-bikes.
Typical price point
What it usually represents
~$3.00
A common starting price for the first ~30 minutes on station-based bike share (pay-as-you-go).
~$3.85
Often-cited average cost for a typical ~30–35 minute station-based pedal-bike trip (pay-as-you-go).
$7.00+
A commonly cited cost for a typical ~30–35 minute station-based e-bike trip, reflecting per-minute surcharges.
~$6.00
A frequently cited average one-way price for dockless e-bikes (and often comparable micromobility devices) in recent U.S. reporting.
Global footprint
Bike sharing is now a mature global category. By the end of 2024, systems operated in 92 countries, with the largest fleet concentrations historically reported in Asia due to the scale of major city programs.
Sources
NACTO (National Association of City Transportation Officials), Shared Micromobility Report: 2023 (released July 2024).
U.S. Department of Energy, Vehicle Technologies Office, Fact of the Week #1366 (published October 28, 2024), citing NACTO data.
The Meddin Bike-Sharing World Map, Report 2024 Edition (global system and fleet counts as of December 31, 2024).
Grand View Research, Bicycle Sharing Market Size & Share, Industry Report, 2030 (2024 market estimate and 2030 projection).