E-bikes are increasingly used for commuting, first/last-mile trips, and employer mobility programs.
ebike commuting trends statistics
Key E-Bike Commuting Trend Statistics
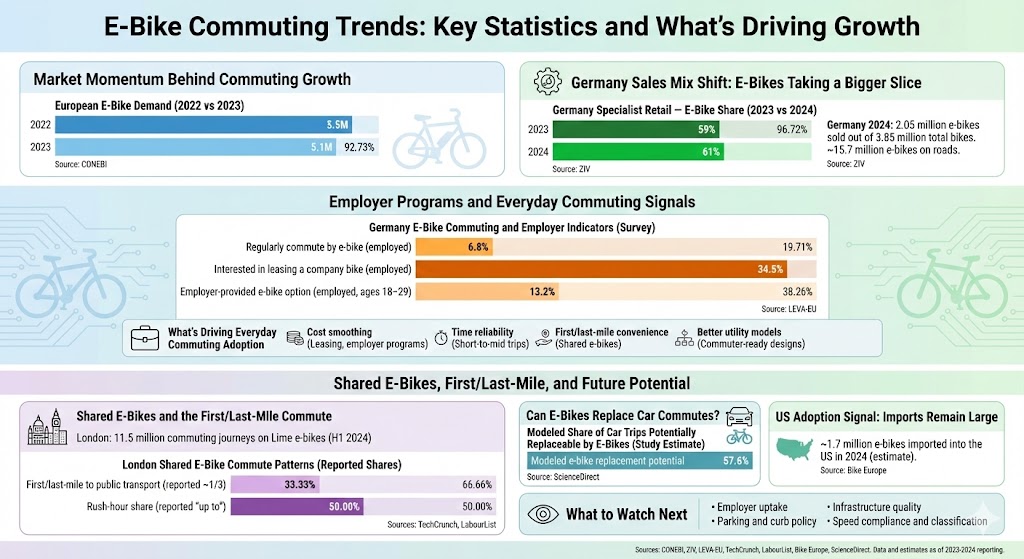
European e-bike demand was 5.1 million units (2023), down from 5.5 million (2022). Source: CONEBI — https://www.conebi.eu/pr-conebi-bimp-2024/
Total bicycle sales in Europe were 11.7 million units (2023) (all bikes), down from 14.7 million (2022). Source: CONEBI — https://www.conebi.eu/pr-conebi-bimp-2024/
Germany sold 3.85 million bikes total in 2024, including 2.05 million e-bikes. Source: ZIV — https://www.ziv-zweirad.de/en/market-data-2024/
In Germany, e-bikes were reported as 53% of units sold in 2024 (all sales channels). Source: ZIV — https://www.ziv-zweirad.de/en/market-data-2024/
Germany’s updated estimate puts ~15.7 million e-bikes on the roads in 2024 (revised estimate). Source: ZIV — https://www.ziv-zweirad.de/en/market-data-2024/
Germany (survey write-up): 6.8% of employed people regularly commute by e-bike; 34.5% are interested in leasing a company bike; 13.2% of employed 18–29-year-olds report an employer-provided e-bike option. Source: LEVA-EU — https://leva-eu.com/e-bike-ownership-in-germany-reaches-record-high/
London (shared e-bikes): 11.5 million commuting journeys were reported on Lime e-bikes in the first half of 2024; about ~1/3 were described as first/last-mile trips to public transport. Source: TechCrunch — https://techcrunch.com/2024/11/26/say-goodbye-to-freeform-dockless-e-bike-parking-in-london-tfl-debuts-new-rules-to-reduce-bike-mess-on-streets/
Shared e-bike commuting-hour usage (reported claim): Lime has stated up to 50% of journeys can occur during rush hour. Source: LabourList — https://labourlist.org/2024/09/e-bikes-labour-local-transport-ambitions-lime/
US (industry estimate reported): ~1.7 million e-bikes imported into the US in 2024 (estimate). Source: Bike Europe — https://www.bike-eu.com/49267/uncertainty-for-us-bicycle-imports-despite-2024-turnaround
Mode-shift potential (modeled): a 2024 study estimated e-bikes could replace 57.6% of car trips in a modeled scenario (potential, not observed behavior). Source: ScienceDirect — https://www.sciencedirect.com/science/article/pii/S2950105924000342
Market Momentum Behind Commuting Growth
Commuting growth often follows availability and normalization: higher e-bike sales increase visibility, service coverage, and retailer familiarity. Europe-wide demand declined slightly in 2023, but e-bikes remain a major category in leading markets.
Chart: European E-Bike Demand (2022 vs 2023)
Label
Bar
Value
2022
5.5M
2023
5.1M
Max = 5.5M. Widths: 2022 100.00%, 2023 92.73%.
Employer Programs and Everyday Commuting Signals
Employer support (leasing and company-bike programs) is a recurring leading indicator for commuter usage because it reduces upfront cost and increases day-to-day practicality.
Chart: Germany E-Bike Commuting and Employer Indicators (Survey)
Max = 34.5%. Widths: Regular commute 19.71%, Interested in leasing 100.00%, Employer option (18–29) 38.26%.
Sales Mix Shift: E-Bikes Taking a Bigger Slice of New-Bike Sales
Sales share matters for commuting because it affects what’s stocked, serviced, and recommended at the “default” retailer level. In Germany’s specialist retail channel, e-bikes were reported at 59% of sales (2023) and 61% (2024).
Chart: Germany Specialist Retail — E-Bike Share (2023 vs 2024)
Label
Bar
Value
2023
59%
2024
61%
Max = 61%. Widths: 2023 96.72%, 2024 100.00%.
Shared E-Bikes and the First/Last-Mile Commute
Shared fleets can convert “too far to walk” into an easy ride—especially around transit hubs. As ridership grows, cities increasingly use parking bays, geofencing, and enforcement to manage clutter and keep sidewalks and entrances clear.
London (reported): 11.5 million commuting journeys on Lime e-bikes in the first half of 2024; about one-third described as first/last-mile trips to public transport. Source: TechCrunch — https://techcrunch.com/2024/11/26/say-goodbye-to-freeform-dockless-e-bike-parking-in-london-tfl-debuts-new-rules-to-reduce-bike-mess-on-streets/
Shared usage pattern (reported claim): up to 50% of journeys can occur during rush hour. Source: LabourList — https://labourlist.org/2024/09/e-bikes-labour-local-transport-ambitions-lime/
Chart: London Shared E-Bike Commute Patterns (Reported Shares)
Label
Bar
Value
First/last-mile to public transport (reported ~1/3)
33.33%
Rush-hour share (reported “up to”)
50.00%
Max = 50.00%. Widths: First/last-mile 66.66%, Rush-hour 100.00%.
Can E-Bikes Replace Car Commutes?
Mode shift depends on trip distance, safe routing, end-of-trip facilities (secure parking, charging), and workplace policy. Research often frames substitution as “potential” rather than guaranteed behavior.
Chart: Modeled Share of Car Trips Potentially Replaceable by E-Bikes (Study Estimate)
Max = 57.6%. Widths: Modeled replacement potential 100.00%.
US Adoption Signal: Imports Remain Large
In the US, the market is split across direct-to-consumer brands, bike-shop channels, and a growing range of commuter-utility and cargo models. One industry estimate reported by Bike Europe suggests ~1.7 million e-bikes were imported into the US in 2024.
What’s Driving Everyday Commuting Adoption
Cost smoothing: Leasing and employer programs reduce upfront price barriers and encourage daily use.
Time reliability: For many short-to-mid trips, e-bikes can be competitive with driving once parking and congestion are considered.
First/last-mile convenience: Shared e-bikes extend the effective reach of rail and bus corridors.
Better utility models: More commuter-ready designs (lights, racks, weather accessories) make regular riding easier.
What to Watch Next
Employer uptake: Leasing interest can be a leading indicator for commuter share growth where programs expand.
Parking and curb policy: Rules for shared fleets (designated bays, geofencing) can increase acceptance and reduce backlash.
Infrastructure quality: Protected lanes and safe intersections tend to matter more than raw distance alone.
Speed compliance and classification: Enforcement and clearer rules can shape which e-bikes are used for commuting and where.
Sources
CONEBI — European Bicycle Industry & Market Profile (BIMP 2024) press release (2022–2023 market data): https://www.conebi.eu/pr-conebi-bimp-2024/
ZIV — German Bicycle Industry market data (2024): https://www.ziv-zweirad.de/en/market-data-2024/
ZIV — Market data presentation (specialist retail e-bike share, 2023 vs 2024): https://www.ziv-zweirad.de/wp-content/uploads/2025/03/ZIV-Market-Data-Presentation-2025-for-2024.pdf
Bike Europe — US 2024 e-bike import estimate (as reported): https://www.bike-eu.com/49267/uncertainty-for-us-bicycle-imports-despite-2024-turnaround
ScienceDirect — 2024 study on e-bike potential to replace car trips (modeled scenario): https://www.sciencedirect.com/science/article/pii/S2950105924000342