E-bike injuries have climbed quickly as ridership has grown, with emergency departments seeing especially sharp increases since 2020. Below are the most useful, source-based statistics (mainly U.S. NEISS/CPSC data) plus what they suggest about risk and prevention.
ebike injury statistics
Key e-bike injury stats at a glance
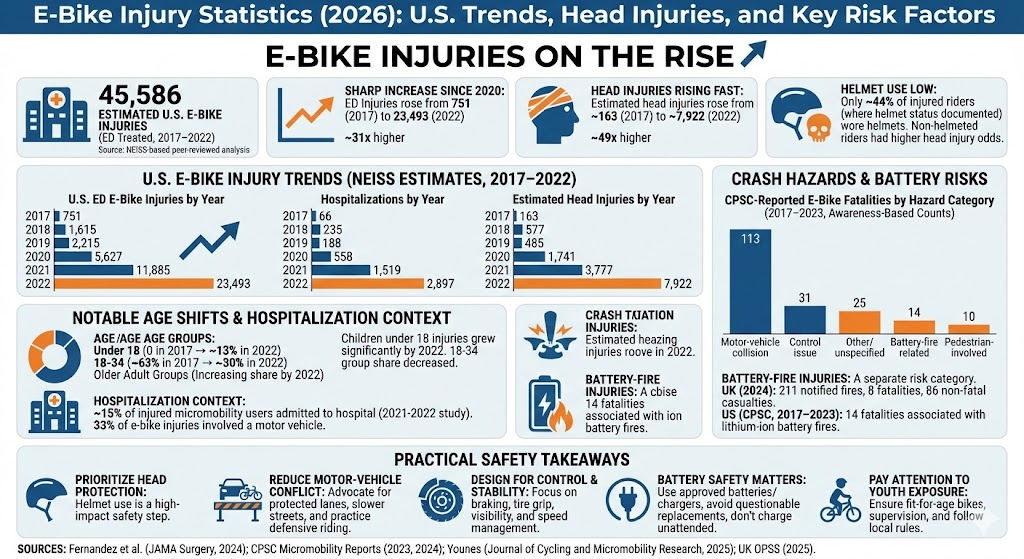
45,586 estimated U.S. e-bike injuries treated in emergency departments (EDs) from 2017–2022 (NEISS-based peer-reviewed analysis).
Estimated ED injuries rose from 751 (2017) to 23,493 (2022) (about 31× higher).
5,462 estimated U.S. e-bike injury hospitalizations from 2017–2022; 2,897 were in 2022.
Estimated head injuries increased from about 163 (2017) to about 7,922 (2022) (about 49× higher).
Among injured riders with helmet status documented, about 44% were reported wearing a helmet; non-helmeted riders had higher odds of head injury in the same analysis.
In a CPSC micromobility report (NEISS-based), estimated U.S. e-bike ED visits were about 34,200 in 2023 vs 24,400 in 2022 (a statistically significant increase), with a 2017 estimate implied at about 3,400.
CPSC staff reported awareness of 193 e-bike fatalities (2017–2023) from incident reports (not a nationally representative count), with motor-vehicle collisions and control issues highlighted as top hazards.
In a large U.S. micromobility ED study of 2021–2022 injuries, about 15% of injured micromobility users presenting to an ED were admitted to the hospital, and 33% of e-bike injuries involved a motor vehicle (vs 26% for bicycles and 23% for e-scooters in that study).
U.S. emergency-department e-bike injuries by year (NEISS estimates, 2017–2022)
A peer-reviewed analysis of the National Electronic Injury Surveillance System (NEISS) estimated rapid growth in ED-treated e-bike injuries from 2017 through 2022.
Hospitalizations are rising alongside ED visits (NEISS estimates, 2017–2022)
Using the same NEISS-based approach, estimated e-bike injury hospitalizations increased sharply from 2017 to 2022. Over 2017–2022, the implied hospitalization share is about 12.0% (5,462 hospitalizations out of 45,586 estimated ED injuries), though this can vary by year and by what cases are captured.
Head injuries are rising faster than overall injuries (NEISS estimates, 2017–2022)
Head injuries are one of the most concerning growth areas. In the same NEISS-based analysis, estimated head injuries rose from about 163 (2017) to about 7,922 (2022). The study also reported that helmet use among injured riders (where helmet status was mentioned) was about 44% overall, and the odds of helmet use decreased year over year in their sample.
Year
Bar
Estimated head injuries
2017
163
2018
577
2019
485
2020
1,741
2021
3,777
2022
7,922
Max = 7,922 head injuries. Widths: 2017 2.06%, 2018 7.28%, 2019 6.12%, 2020 21.98%, 2021 47.68%, 2022 100.00%.
Who is getting hurt: notable age shifts
One striking finding in the 2017–2022 NEISS analysis is how the age mix changed over time:
Children under 18 went from 0 estimated injuries (2017) to about 3,024 (2022), roughly 13% of estimated injuries in 2022.
The 18–34 group made up about 63% of injuries in 2017, falling to about 30% by 2022 (still a large share, but less dominant).
Older adult groups (35–54 and 55+) accounted for a larger share by 2022 than they did in 2017, consistent with broader adoption.
Crash circumstances: motor vehicles and loss of control stand out
Two data streams point to a similar pattern: e-bike injuries and fatalities are often connected to interactions with motor vehicles and/or control loss events.
In a large U.S. micromobility ED analysis of 2021–2022 cases, 33% of e-bike injuries involved a motor vehicle (higher than the reported share for bicycles and e-scooters in that study).
In CPSC’s 2017–2023 fatality review (incident reports, not a national fatality rate), the agency highlighted motor-vehicle collisions and control issues among leading hazards for e-bike fatalities.
CPSC-reported e-bike fatalities by hazard category (2017–2023, awareness-based counts)
Based on CPSC staff’s review of the 193 e-bike fatalities they were aware of from 2017–2023, the categories below show how heavily motor-vehicle collisions dominate. “Other/unspecified” is the remainder after the listed categories.
Hazard category
Bar
Fatalities
Motor-vehicle collision
113
Control issue (single-vehicle/objects/curbs)
31
Other/unspecified
25
Battery-fire related
14
Pedestrian-involved
10
Max = 113 fatalities. Widths: Motor-vehicle collision 100.00%, Control issue (single-vehicle/objects/curbs) 27.43%, Other/unspecified 22.12%, Battery-fire related 12.39%, Pedestrian-involved 8.85%.
Battery-fire injuries are a separate risk category (non-crash harm)
Not all e-bike harm is from roadway crashes. Lithium-ion battery failures can cause fires that lead to injuries and fatalities, often indoors during storage or charging.
United Kingdom (OPSS, 2024):211 e-bike/e-scooter fires notified in 2024, with 8 fatalities across 5 fatal incidents and 86 non-fatal casualties reported across 42 fires. (Counts are based on notifications and may understate the true totals.)
United States (CPSC, 2017–2023 awareness-based review): CPSC staff reported 14 e-bike fatalities associated with lithium-ion battery-related fires among the 193 e-bike fatalities they were aware of.
Practical safety takeaways implied by the statistics
Prioritize head protection: the steep growth in head injuries makes helmet use one of the highest-impact, lowest-cost steps for many riders.
Reduce motor-vehicle conflict: the combination of (a) higher motor-vehicle involvement in e-bike injuries in ED datasets and (b) motor-vehicle collisions dominating reported fatality hazards supports infrastructure and behavior that limits mixing speeds (protected lanes, slower streets, defensive riding).
Design for control and stability: control-loss and fixed-object crashes show up repeatedly, which aligns with focusing on braking, tire grip/pressure, visibility, and speed management.
Battery safety matters: use manufacturer-approved batteries/chargers, avoid questionable replacements, and don’t charge unattended—fire data show meaningful injury/fatality consequences even outside traffic environments.
Pay attention to youth exposure: the growing share of injuries among under-18 riders suggests a need for fit-for-age bikes, supervision, and clear local rules around classes and speeds.
Sources
Fernandez AM, Li Y, Patel M, et al. Electric Bicycle Injuries and Hospitalizations (NEISS, 2017–2022). JAMA Surgery (published online Feb 21, 2024). https://pmc.ncbi.nlm.nih.gov/articles/PMC10882498/
U.S. Consumer Product Safety Commission (CPSC). E-Scooter and E-Bike Injuries Soar: 2022 Injuries Increased Nearly 21% (Release Date: Oct 17, 2023). https://www.cpsc.gov/Newsroom/News-Releases/2024/E-Scooter-and-E-Bike-Injuries-Soar-2022-Injuries-Increased-Nearly-21
Younes H. Comparing injuries from e-scooters, e-bikes, and bicycles in the United States (2021–2022 ED injuries). Journal of Cycling and Micromobility Research, June 2025. https://www.sciencedirect.com/science/article/pii/S2950105925000051
UK Office for Product Safety and Standards (OPSS). Fires in e-bikes and e-scooters – 2024 (published Jun 5, 2025; 2024 incidents). https://www.gov.uk/government/publications/fires-in-e-bikes-and-e-scooters/fires-in-e-bikes-and-e-scooters-2024